Python source code: plot_canny.py
from scipy import ndimage
import matplotlib.pyplot as plt
#from scikits.image.filter import canny
from image_source_canny import canny
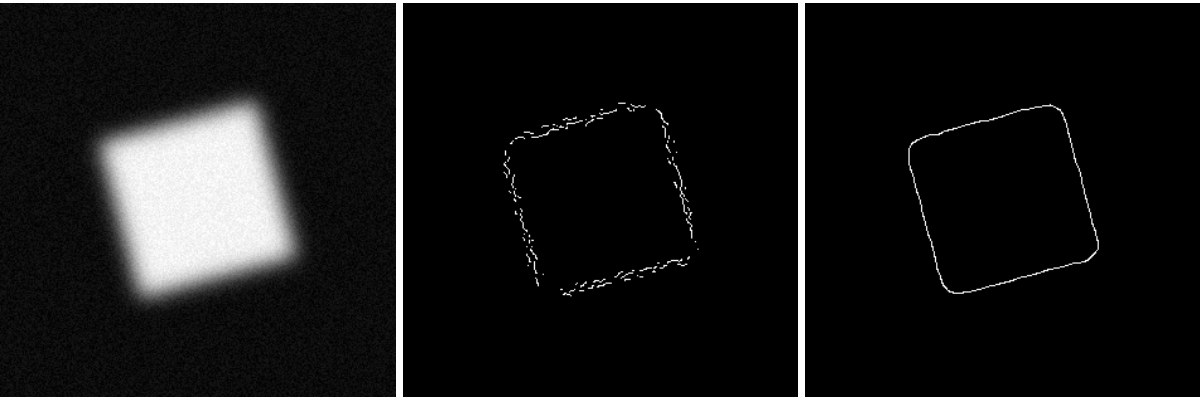
im = np.zeros((256, 256))
im[64:-64, 64:-64] = 1
im = ndimage.rotate(im, 15, mode='constant')
im = ndimage.gaussian_filter(im, 8)
im += 0.1*np.random.random(im.shape)
edges = canny(im, 1, 0.4, 0.2)
plt.figure(figsize=(12, 4))
plt.subplot(131)
plt.imshow(im, cmap=plt.cm.gray)
plt.axis('off')
plt.subplot(132)
plt.imshow(edges, cmap=plt.cm.gray)
plt.axis('off')
edges = canny(im, 3, 0.3, 0.2)
plt.subplot(133)
plt.imshow(edges, cmap=plt.cm.gray)
plt.axis('off')
plt.subplots_adjust(wspace=0.02, hspace=0.02, top=1, bottom=0, left=0, right=1)
plt.show()
