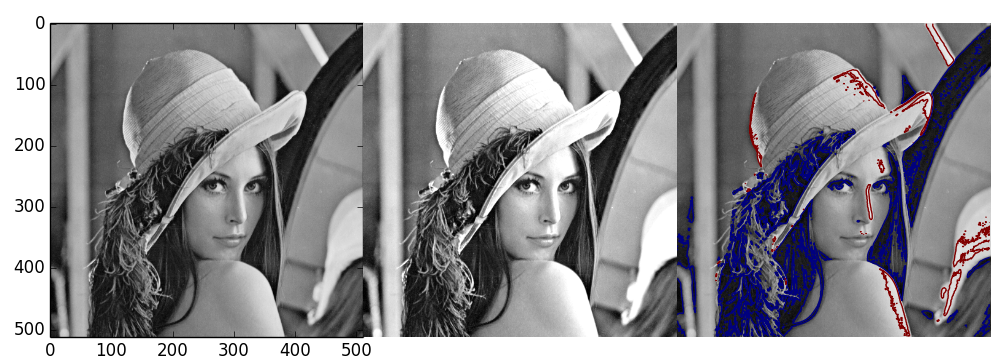
Python source code: plot_display_lena.py
import matplotlib.pyplot as plt

l = scipy.misc.lena()

plt.figure(figsize=(10, 3.6))

plt.subplot(131)
plt.imshow(l, cmap=plt.cm.gray)

plt.subplot(132)
plt.imshow(l, cmap=plt.cm.gray, vmin=30, vmax=200)
plt.axis('off')

plt.subplot(133)
plt.imshow(l, cmap=plt.cm.gray)
plt.contour(l, [60, 211])
plt.axis('off')

plt.subplots_adjust(wspace=0, hspace=0., top=0.99, bottom=0.01, left=0.05,
                    right=0.99)
plt.show()