Python source code: plot_measure_data.py
from scipy import ndimage
import matplotlib.pyplot as plt
np.random.seed(1)
n = 10
l = 256
im = np.zeros((l, l))
points = l*np.random.random((2, n**2))
im[(points[0]).astype(np.int), (points[1]).astype(np.int)] = 1
im = ndimage.gaussian_filter(im, sigma=l/(4.*n))
mask = im > im.mean()
label_im, nb_labels = ndimage.label(mask)
sizes = ndimage.sum(mask, label_im, range(nb_labels + 1))
mask_size = sizes < 1000
remove_pixel = mask_size[label_im]
label_im[remove_pixel] = 0
labels = np.unique(label_im)
label_clean = np.searchsorted(labels, label_im)
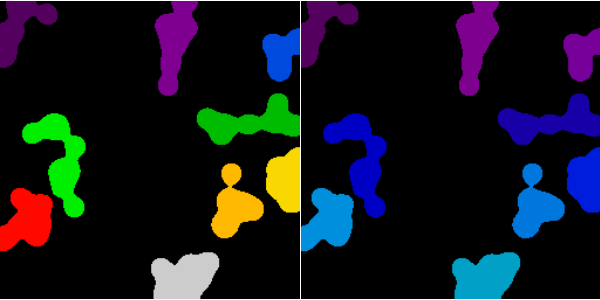
plt.figure(figsize=(6 ,3))
plt.subplot(121)
plt.imshow(label_im, cmap=plt.cm.spectral)
plt.axis('off')
plt.subplot(122)
plt.imshow(label_clean, vmax=nb_labels, cmap=plt.cm.spectral)
plt.axis('off')
plt.subplots_adjust(wspace=0.01, hspace=0.01, top=1, bottom=0, left=0, right=1)
plt.show()
