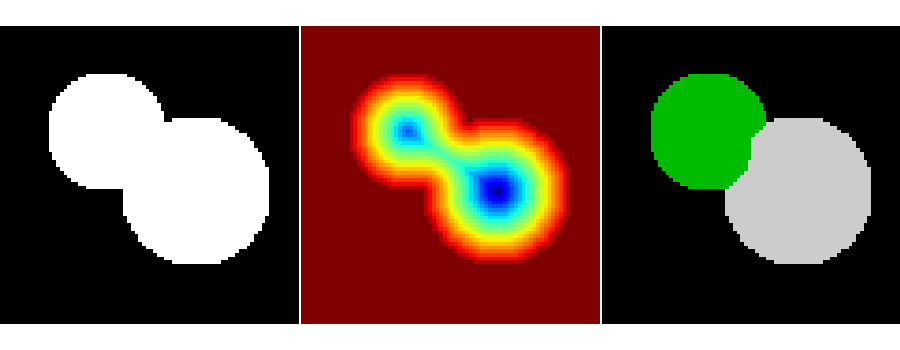
Python source code: plot_watershed_segmentation.py
from skimage.morphology import watershed, is_local_maximum
import matplotlib.pyplot as plt
from scipy import ndimage

# Generate an initial image with two overlapping circles
x, y = np.indices((80, 80))
x1, y1, x2, y2 = 28, 28, 44, 52
r1, r2 = 16, 20
mask_circle1 = (x - x1) ** 2 + (y - y1) ** 2 < r1 ** 2
mask_circle2 = (x - x2) ** 2 + (y - y2) ** 2 < r2 ** 2
image = np.logical_or(mask_circle1, mask_circle2)
# Now we want to separate the two objects in image
# Generate the markers as local maxima of the distance
# to the background
distance = ndimage.distance_transform_edt(image)
local_maxi = is_local_maximum(distance, image, np.ones((3, 3)))
markers = ndimage.label(local_maxi)[0]
labels = watershed(-distance, markers, mask=image)

plt.figure(figsize=(9, 3.5))
plt.subplot(131)
plt.imshow(image, cmap='gray', interpolation='nearest')
plt.axis('off')
plt.subplot(132)
plt.imshow(-distance, interpolation='nearest')
plt.axis('off')
plt.subplot(133)
plt.imshow(labels, cmap='spectral', interpolation='nearest')
plt.axis('off')

plt.subplots_adjust(hspace=0.01, wspace=0.01, top=1, bottom=0, left=0,
                    right=1)
plt.show()