Python source code: plot_axes.py
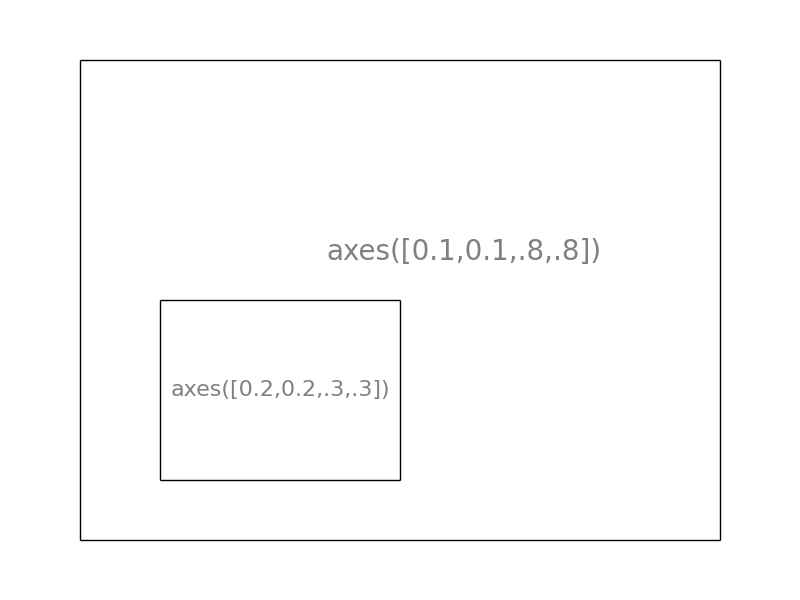
pl.axes([.1, .1, .8, .8])
pl.xticks(())
pl.yticks(())
pl.text(.6, .6, 'axes([0.1,0.1,.8,.8])', ha='center', va='center',
        size=20, alpha=.5)

pl.axes([.2, .2, .3, .3])
pl.xticks(())
pl.yticks(())
pl.text(.5, .5, 'axes([0.2,0.2,.3,.3])', ha='center', va='center',
        size=16, alpha=.5)

pl.show()
