Python source code: plot_exercice_1.py
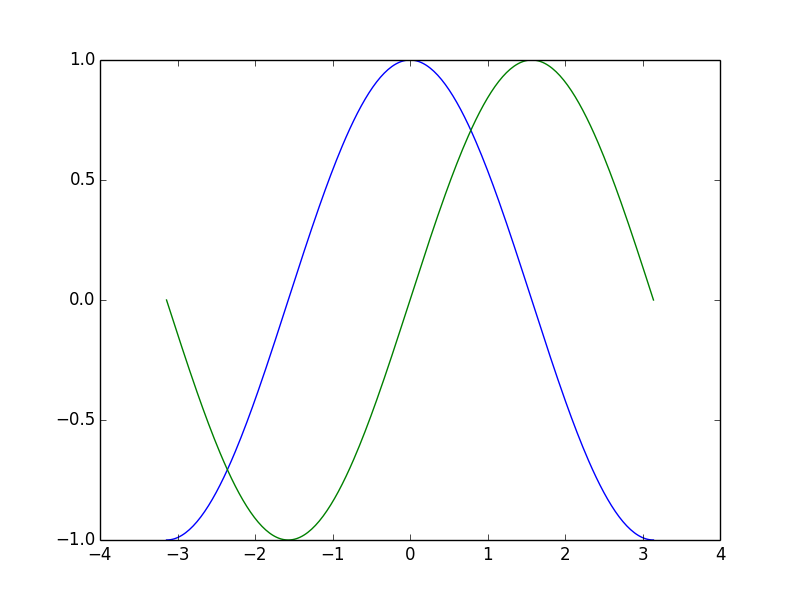
import numpy as np

n = 256
X = np.linspace(-np.pi, np.pi, 256, endpoint=True)
C,S = np.cos(X), np.sin(X)
pl.plot(X, C)
pl.plot(X,S)

pl.show()