Python source code: plot_exercice_2.py
import numpy as np
# Create a new figure of size 8x6 points, using 100 dots per inch
pl.figure(figsize=(8, 6), dpi=80)
# Create a new subplot from a grid of 1x1
pl.subplot(111)
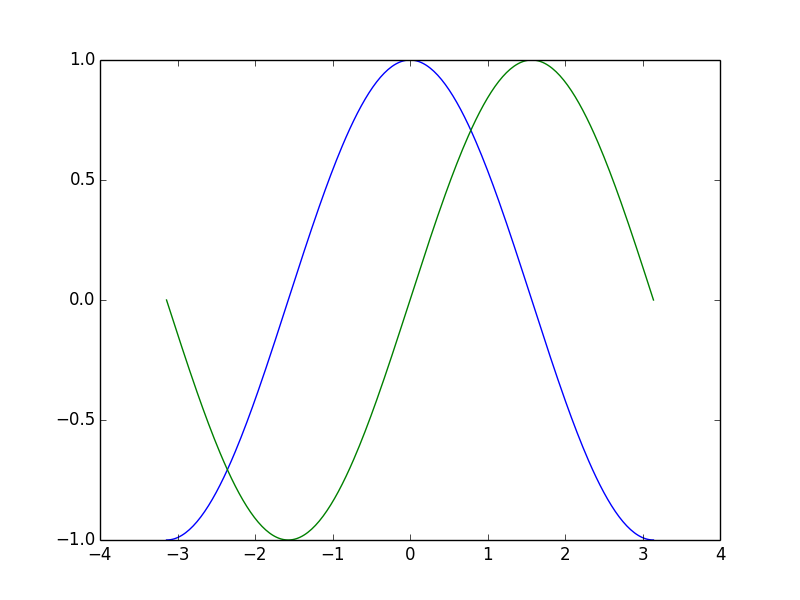
X = np.linspace(-np.pi, np.pi, 256, endpoint=True)
C, S = np.cos(X), np.sin(X)
# Plot cosine using blue color with a continuous line of width 1 (pixels)
pl.plot(X, C, color="blue", linewidth=1.0, linestyle="-")
# Plot sine using green color with a continuous line of width 1 (pixels)
pl.plot(X, S, color="green", linewidth=1.0, linestyle="-")
# Set x limits
pl.xlim(-4., 4.)
# Set x ticks
pl.xticks(np.linspace(-4, 4, 9, endpoint=True))
# Set y limits
pl.ylim(-1.0, 1.0)
# Set y ticks
pl.yticks(np.linspace(-1, 1, 5, endpoint=True))
# Show result on screen
pl.show()
