Python source code: plot_imshow_ex.py
import numpy as np
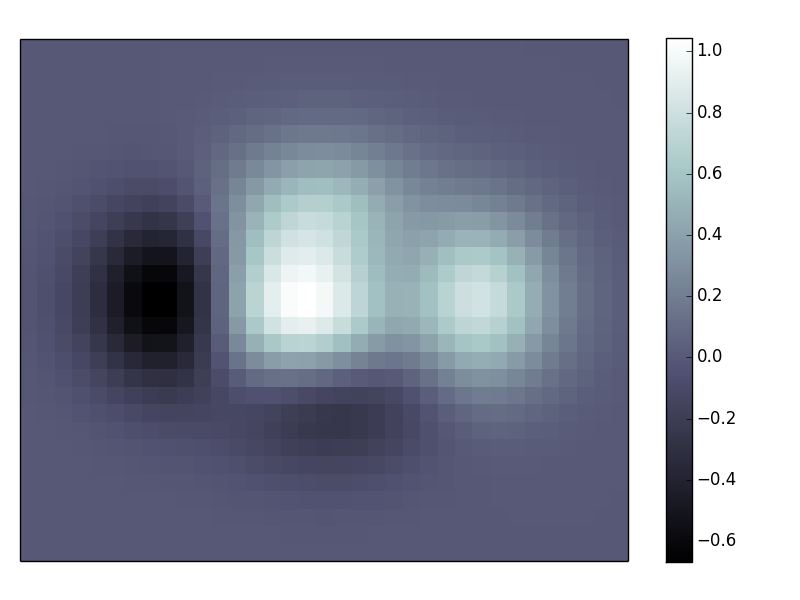
def f(x, y):
return (1 - x / 2 + x ** 5 + y ** 3 ) * np.exp(-x ** 2 - y ** 2)
n = 10
x = np.linspace(-3, 3, 3.5 * n)
y = np.linspace(-3, 3, 3.0 * n)
X, Y = np.meshgrid(x, y)
Z = f(X, Y)
pl.axes([0.025, 0.025, 0.95, 0.95])
pl.imshow(Z, interpolation='nearest', cmap='bone', origin='lower')
pl.colorbar(shrink=.92)
pl.xticks(())
pl.yticks(())
pl.show()
