Python source code: plot_scatter_ex.py
import numpy as np
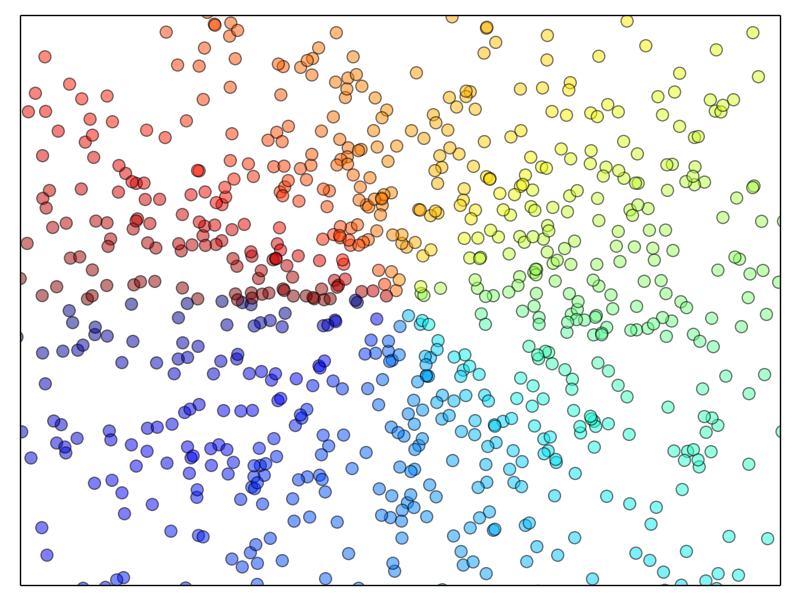
n = 1024
X = np.random.normal(0, 1, n)
Y = np.random.normal(0, 1, n)
T = np.arctan2(Y, X)
pl.axes([0.025, 0.025, 0.95, 0.95])
pl.scatter(X, Y, s=75, c=T, alpha=.5)
pl.xlim(-1.5, 1.5)
pl.xticks(())
pl.ylim(-1.5, 1.5)
pl.yticks(())
pl.show()
