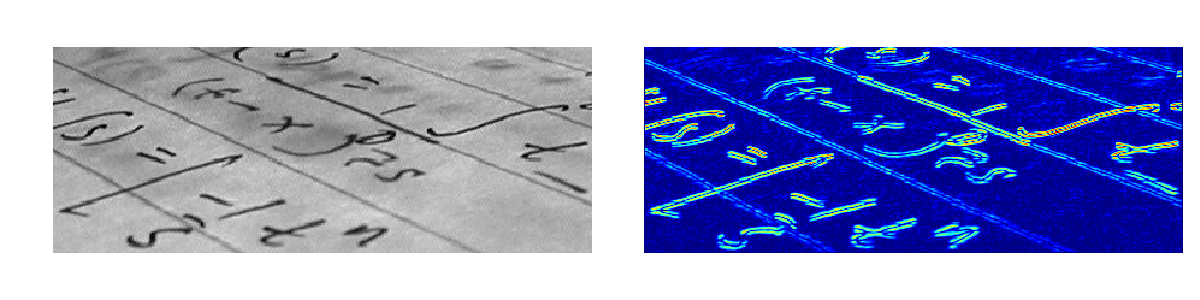
This example illustrates the use of the horizontal Sobel filter, to compute horizontal gradients.
Python source code: plot_sobel.py
from skimage import data, filter
import matplotlib.pyplot as plt

text = data.text()
hsobel_text = filter.hsobel(text)

plt.figure(figsize=(12, 3))

plt.subplot(121)
plt.imshow(text, cmap='gray', interpolation='nearest')
plt.axis('off')
plt.subplot(122)
plt.imshow(hsobel_text, cmap='jet', interpolation='nearest')
plt.axis('off')
plt.tight_layout()
plt.show()
