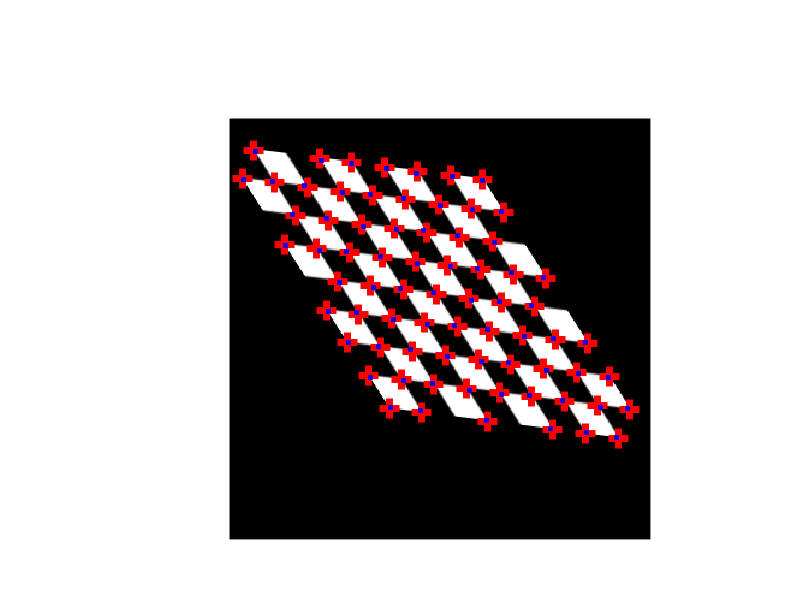
Python source code: plot_features.py
from skimage import data
from skimage.feature import corner_harris, corner_subpix, corner_peaks
from skimage.transform import warp, AffineTransform


tform = AffineTransform(scale=(1.3, 1.1), rotation=1, shear=0.7,
                        translation=(210, 50))
image = warp(data.checkerboard(), tform.inverse, output_shape=(350, 350))

coords = corner_peaks(corner_harris(image), min_distance=5)
coords_subpix = corner_subpix(image, coords, window_size=13)

plt.gray()
plt.imshow(image, interpolation='nearest')
plt.plot(coords_subpix[:, 1], coords_subpix[:, 0], '+r', markersize=15, mew=5)
plt.plot(coords[:, 1], coords[:, 0], '.b', markersize=7)
plt.axis('off')
plt.show()